Data Visualization Techniques for SMBs

In today's data-driven business landscape, small and medium-sized businesses (SMBs) are increasingly recognizing the power of data visualization. With ApiaryAnalytics, these businesses can transform raw data into actionable insights, driving informed decision-making and fostering growth.
Why Data Visualization Matters for SMBs
Data visualization is not just for large corporations. SMBs can leverage these techniques to:
- Identify trends and patterns quickly
- Make data-driven decisions with confidence
- Communicate complex information to stakeholders effectively
- Boost productivity and streamline operations
Effective Data Visualization Techniques
1. Interactive Dashboards
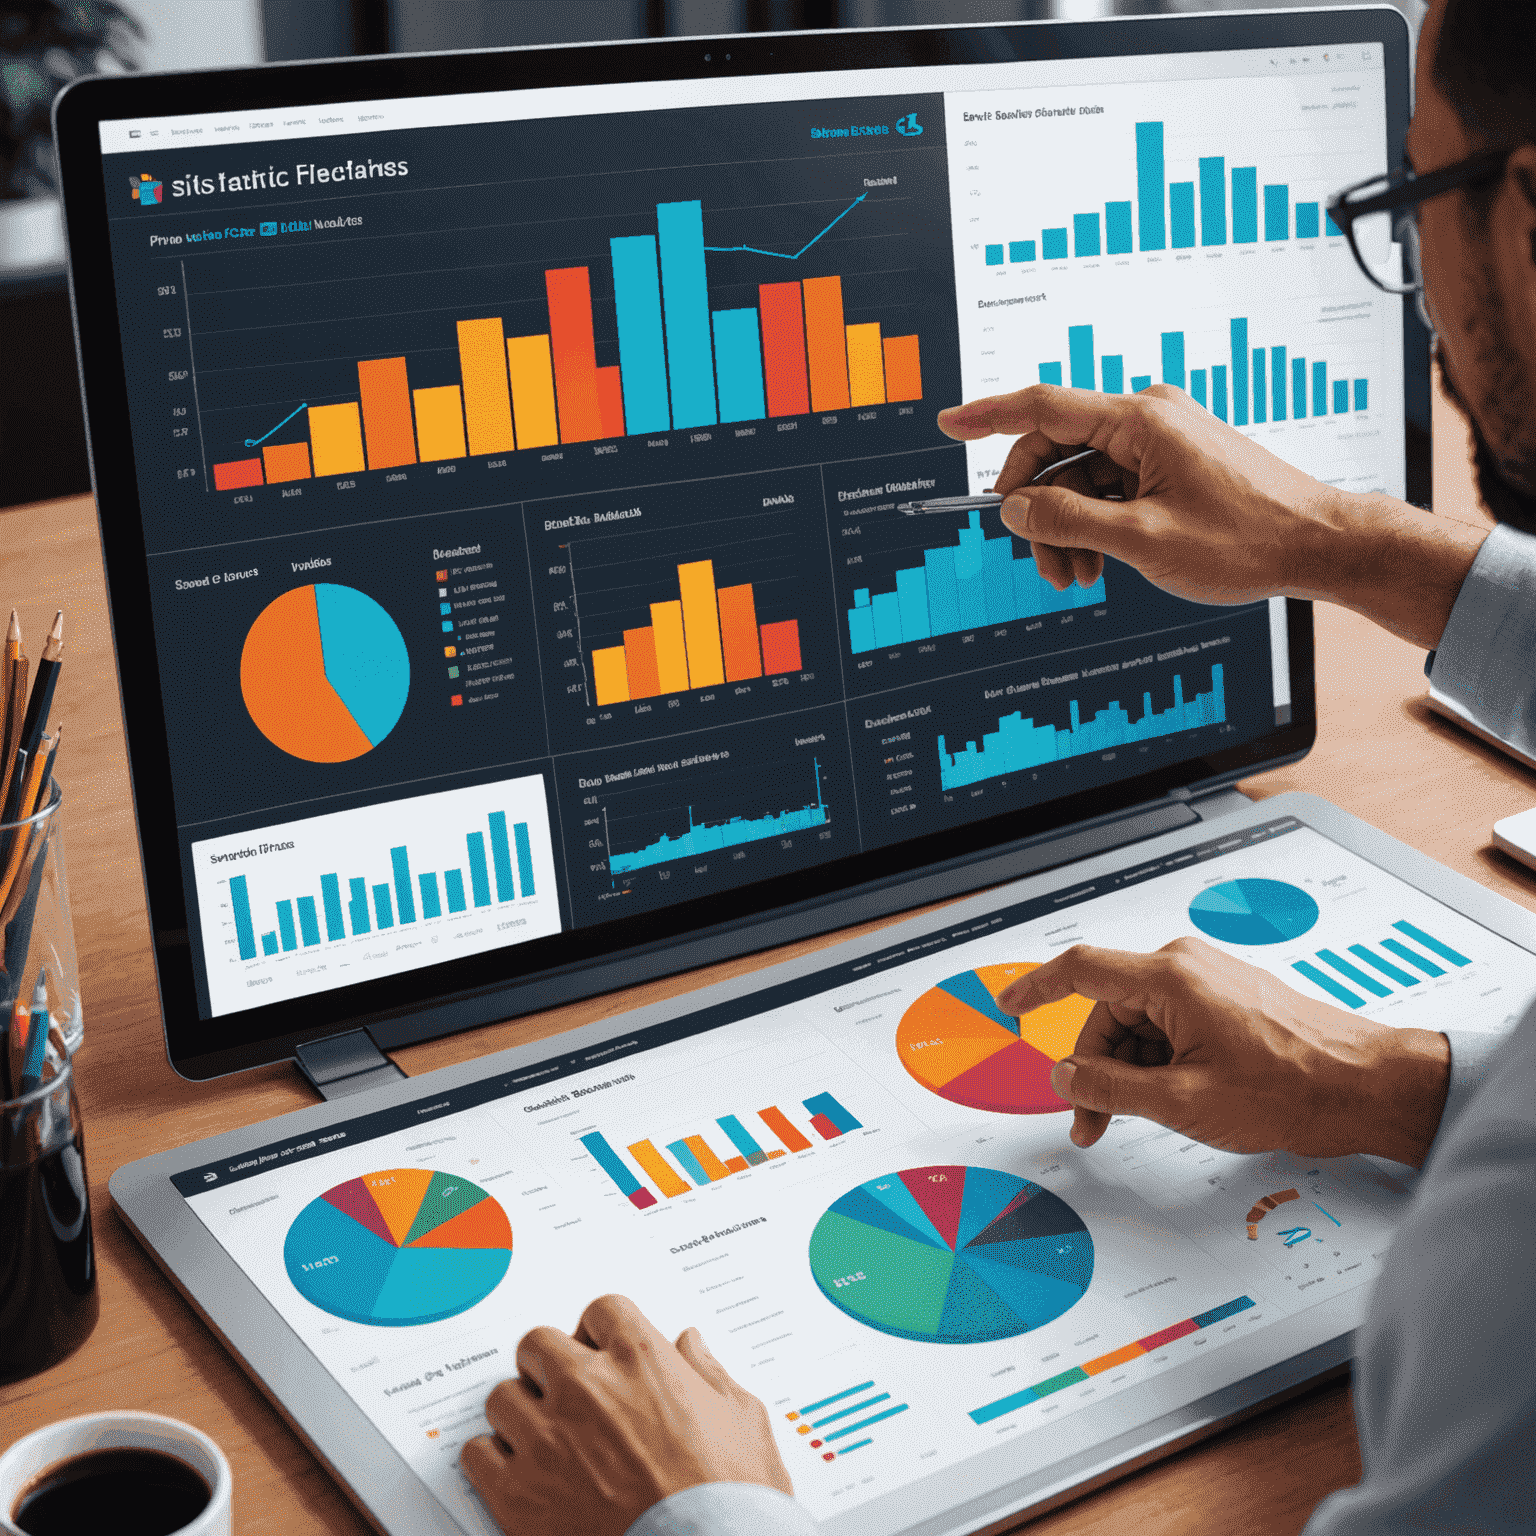
ApiaryAnalytics offers customizable dashboards that allow SMBs to visualize key performance indicators (KPIs) in real-time. These interactive displays provide a comprehensive overview of business performance at a glance.
2. Heat Maps
Perfect for identifying patterns in large datasets, heat maps can help SMBs visualize customer behavior, sales trends, or even beehive activity for agricultural businesses using our apiary tech solutions.
3. Scatter Plots
Ideal for showing relationships between variables, scatter plots can help SMBs understand correlations in their data, such as the relationship between marketing spend and revenue.
4. Funnel Charts
Essential for visualizing stages in a process, funnel charts are particularly useful for sales and marketing teams to track conversion rates and identify bottlenecks in the sales funnel.
Leveraging ApiaryAnalytics for SMB Data Visualization
ApiaryAnalytics provides a suite of tools tailored for SMBs, including those in niche markets like beekeeping and agriculture. Our platform offers:
- Modular BI components for customized analytics
- Responsive design for access across all devices
- AI-powered insights for predictive analytics
- Robust data security measures

Case Study: Smart Beekeeping with Data Visualization
Consider how a small-scale honey producer utilizes ApiaryAnalytics to revolutionize their operations:
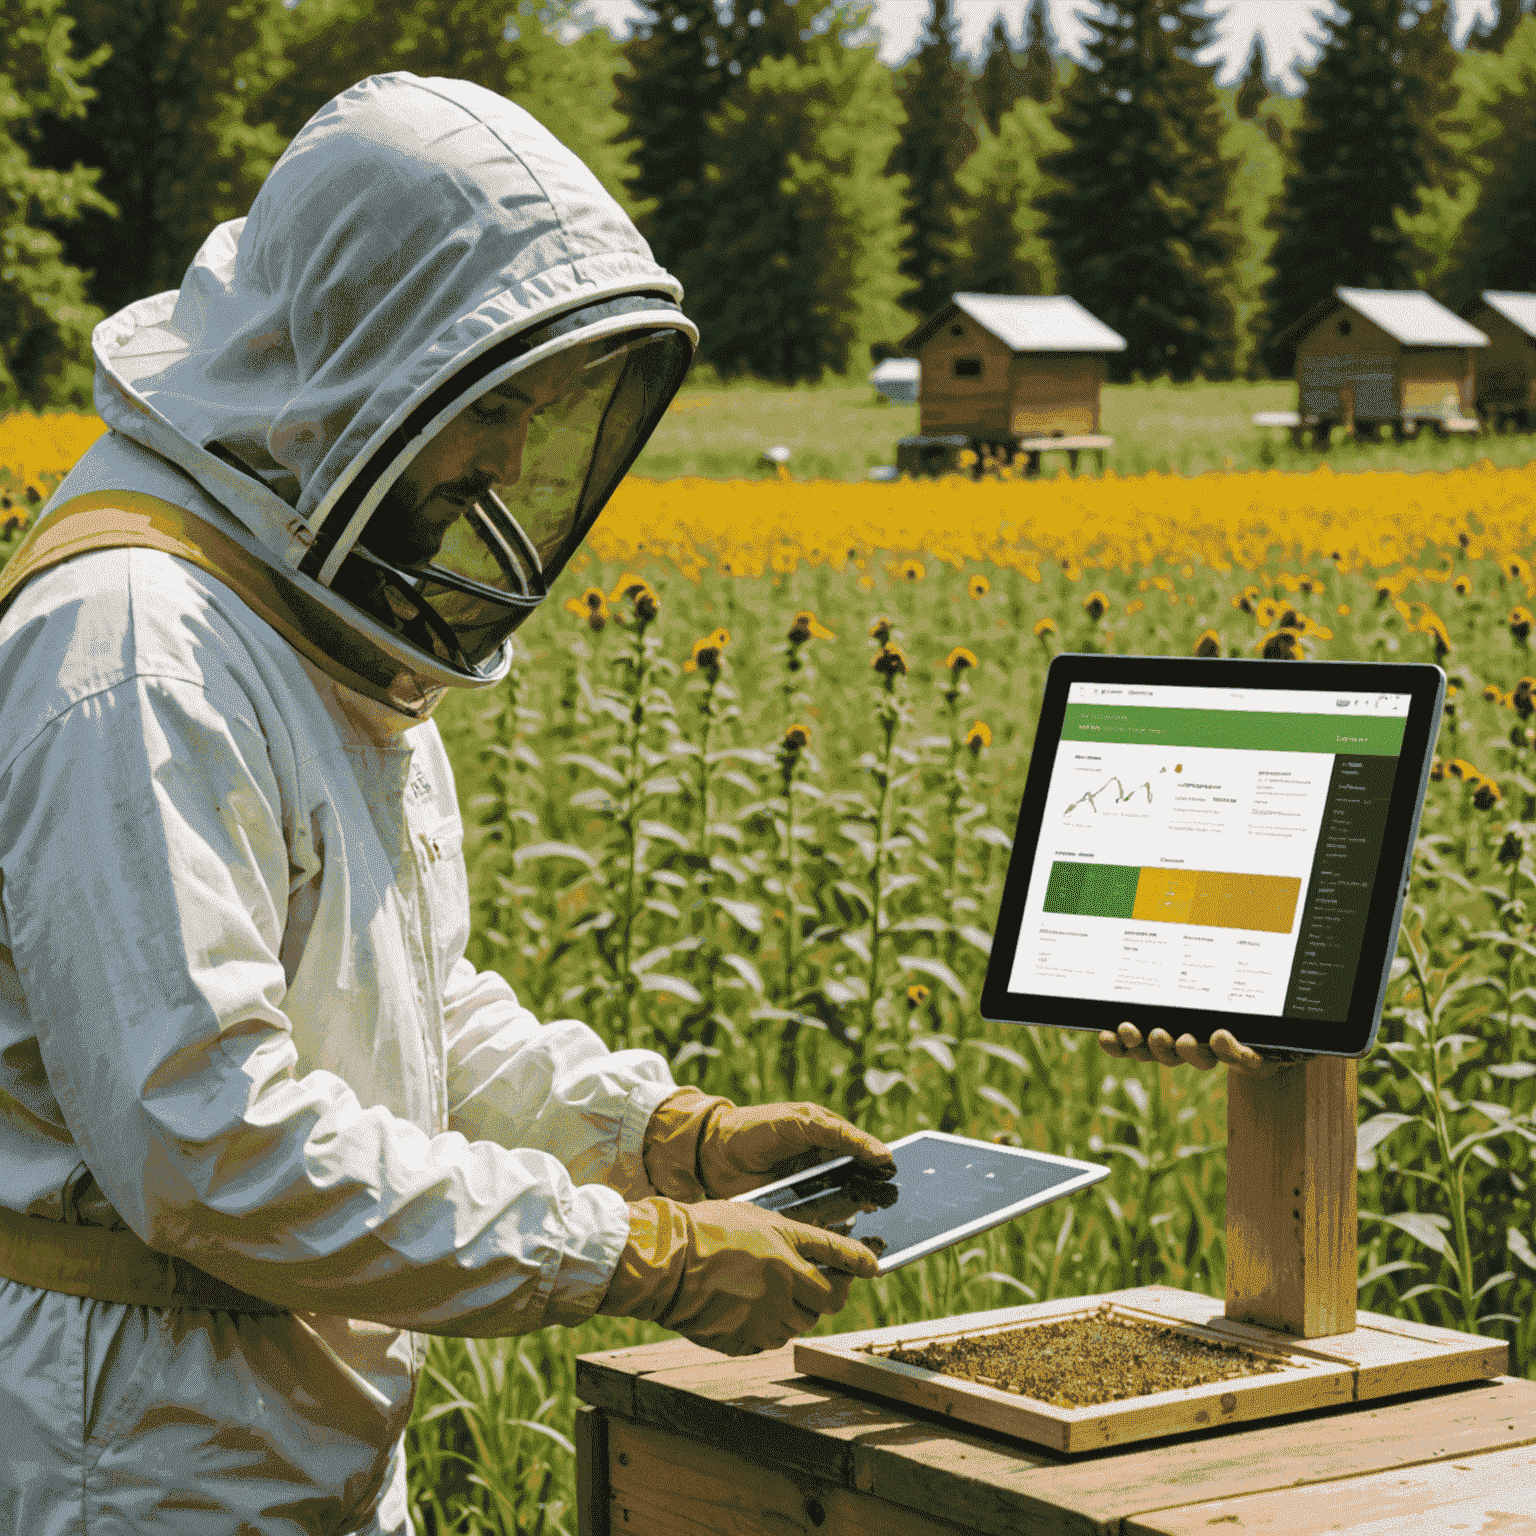
- Hive Monitoring: Interactive charts display real-time data on hive temperature, humidity, and weight.
- Harvest Forecasting: Predictive models visualize expected honey yields based on historical data and current conditions.
- Resource Optimization: Heat maps show the most productive areas of the apiary, guiding hive placement decisions.
- Market Analysis: Trend lines and bar charts illustrate honey demand and pricing fluctuations, informing sales strategies.
By leveraging these visualization techniques, the beekeeper can make informed decisions, optimize their operations, and ultimately increase profitability.
Conclusion
Data visualization is a powerful tool for SMBs looking to gain a competitive edge. With ApiaryAnalytics, businesses can transform complex data into clear, actionable insights. Whether you're managing an apiary, running a local retail store, or overseeing a growing tech startup, our platform provides the visualization techniques you need to thrive in today's data-driven world.
Unlock the power of your data with ApiaryAnalytics – where small business meets big insights.
